


In investment, knowledge is power. Understanding the various investment tools and processes is key to making informed investment decisions. Among the most essential tools you’ll need as an investor is the ability to understand and interpret a candlestick chart. In this article, we will unfold the layers of candlestick chart analysis for long-term investors.
The Basics of Candlestick Charts
Alt Text: A candlestick chart software running on iPad
Understanding the basics of candlestick charts involves learning about candlestick shapes and patterns. A candlestick has two main parts: the body and the shadow. The body represents the open and closed prices, while the shadow (or wick) shows the high and low prices.
Candlestick patterns come in various forms, each communicating a unique market sentiment. Some common patterns include Doji, Hammer, Hanging Man, and Shooting Star.
One crucial aspect of candlestick patterns is confirmation. For instance, a bullish candlestick pattern must be confirmed by a subsequent price rise before it’s considered a reliable buy signal. The same principle applies to bearish patterns, which must be confirmed by a subsequent price drop to be deemed a reliable sell signal.
Beyond the patterns, understanding their interpretations and the market conditions under which they occur is equally important. For example, the Doji often signifies market indecision, but its appearance at the market bottom might suggest a reversal.
Candlestick Chart Analysis and Market Trends
Candlestick chart analysis is instrumental in spotting market trends. Long-term investors leverage this tool to identify possible market turning points, evaluate risk levels, and set investment goals.
The visual representation of price movement in candlestick chart analysis offers valuable insight into market sentiments and trends. For instance, a series of long-bodied, upward-moving candlesticks could indicate a strong bullish trend, a crucial piece of information for long-term investors.
However, for the analysis to serve its purpose, investors must use it alongside other technical analysis tools and fundamentals. The ability to spot and interpret investing trends using candlestick chart analysis can be the difference between profit and loss. It gives the investor an edge by providing a clearer picture of the market dynamics.
Using Candlestick Charts for Investment Decisions
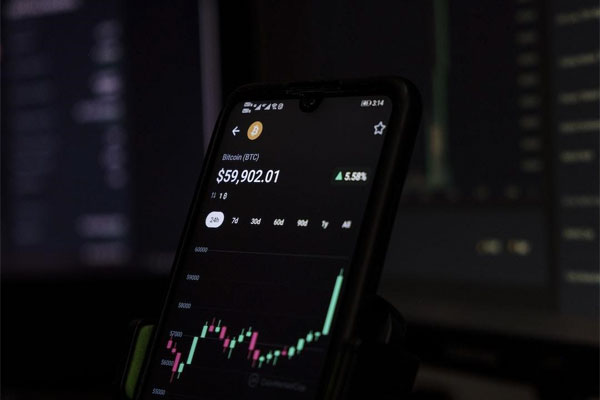
Alt Text: A candlestick chart on a phone
Putting the knowledge into practice is fundamental. Long-term investors often use candlestick charts to make critical investment decisions like buying, selling, or holding positions.
One effective way to use candlestick charts is tracking the various patterns against market events such as policy changes, market disruptions, and other influencing factors. This practice provides context to the observed patterns and improves investment decisions.
The insights derived from candlestick chart analysis can also guide portfolio diversification. For example, a bearish trend across several stocks could signal the need for investing in more stable assets or those displaying bullish trends for balance.
Common Mistakes with Candlestick Charts
While candlestick chart analysis is a powerful tool, wrong usage can lead to loss-making decisions. One common mistake is acting based on individual candlestick patterns without considering the broader market trend or underlying fundamentals.
Investors also often interpret candlestick patterns as absolute buy or sell signals. However, these patterns merely suggest likely future price movements, not certainty. As a protective measure, investors should always wait for pattern confirmation.
Another pitfall is over-reliance on candlestick chart analysis. Although useful, it should be used alongside other technical and fundamental analysis tools for a comprehensive understanding of market conditions.
Altogether, understanding and effectively using candlestick chart analysis is critical for long-term investment success. Master the basics, avoid the common mistakes, and harness the power in your future investments.


